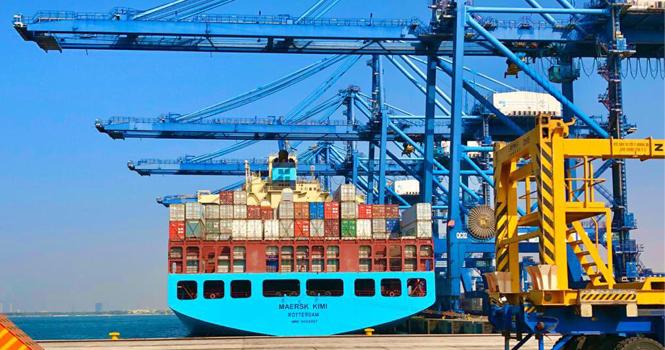
Saudi merchandise imports rise to SAR 201.1B in Q1 2024
Saudi Arabia’s merchandise imports grew by 6% year-on-year (YoY) to almost SAR 201.1 billion in Q1 2024, according to data issued by the General Authority for Statistics (GASTAT).
On a quarterly basis, merchandise imports fell by 0.3%, or nearly SAR 650.2 million.
The following table illustrates the Saudi merchandise imports since 2017:
| Saudi Merchandise Imports Since 2017 | ||
| Period | Value (SAR bln) | Change YoY |
| Q1 2017 | 125.72 | -- |
| Q2 | 126.71 | -- |
| Q3 | 123.85 | -- |
| Q4 | 128.16 | -- |
| Q1 2018 | 126.06 | +0.3% |
| Q2 | 133.02 | +5% |
| Q3 | 128.02 | +3% |
| Q4 | 126.90 | (1%) |
| Q1 2019 | 132.19 | +5% |
| Q2 | 151.82 | +14% |
| Q3 | 145.45 | +14% |
| Q4 | 144.90 | +14% |
| Q1 2020 | 132.38 | +0.1% |
| Q2 | 124.85 | (18%) |
| Q3 | 123.03 | (15%) |
| Q4 | 137.23 | (5%) |
| Q1 2021 | 139.39 | +5% |
| Q2 | 140.42 | +12% |
| Q3 | 144.76 | +18% |
| Q4 | 148.61 | +8% |
| Q1 2022 | 157.90 | +13% |
| Q2 | 175.35 | +25% |
| Q3 | 182.81 | +26% |
| Q4 | 195.97 | +32% |
| Q1 2023 | 188.95 | +20% |
| Q2 | 190.35 | +9% |
| Q3 | 194.99 | +7% |
| Q4 | 201.73 | +3% |
| Q1 2024 | 201.08 | +6% |
*Data are periodically updated
Machinery and mechanical appliances, electrical equipment, and parts thereof dominated 23% of total imports. Vehicles, aircraft, vessels, and associated transport equipment came in second with 13%.
The following table illustrates Saudi merchandise in Q1 2024 by segment:
| Saudi Imports Value in Q1 2024 (SAR bln) | ||||
| Segment | Q1 2023 | Q1 2024 | Change | Change (%) |
| Machinery and Mechanical Appliances; Electrical Equipment and Parts Thereof | 40.09 | 45.63 | +5.54 | +14% |
| Vehicles, Aircraft, Vessels and Associated Transport Equipment | 26.78 | 26.17 | (0.61) | (2%) |
| Products of Chemical or Allied Industries | 18.27 | 18.63 | +0.36 | +2% |
| Base Metals and Articles of Base Metals | 16.63 | 18.21 | +1.58 | +10% |
| Mineral Products | 13.74 | 14.22 | +0.49 | +4% |
| Natural or Cultured Pearls, Precious or Semi-Precious Stones, Precious Metals | 6.22 | 11.68 | +5.46 | +88% |
| Food Industry Products, Beverages, Alcoholic Liquids and Vinegar, Tobacco and Manufactured Tobacco Substitutes | 9.53 | 10.04 | +0.51 | +5% |
| Vegetable Products | 11.00 | 9.72 | (1.28) | (12%) |
| Live Animals and Animal Products | 6.27 | 7.19 | +0.92 | +15% |
| Textile products | 7.00 | 6.92 | (0.07) | (1%) |
| Others | 33.43 | 32.67 | (0.77) | (2%) |
| Total | 188.95 | 201.08 | +12.13 | +6% |
China topped the Kingdom's list of exporting countries with SAR 41.9 billion, accounting for 21% of total imports in Q1 2024. The US and the UAE followed, at 8% and 7%, respectively.
| Top 10 Exporters to Saudi Arabia in Q1 2024 (SAR bln) | ||
| Countries | Value | % of Total |
| China | 41.9 | 20.9% |
| US | 16.2 | 8.1% |
| UAE | 13.6 | 6.8% |
| India | 13.1 | 6.5% |
| Egypt | 8.2 | 4.1% |
| Switzerland | 7.8 | 3.9% |
| Germany | 7.5 | 3.7% |
| Japan | 6.9 | 3.5% |
| Italy | 6.1 | 3.1% |
| South Korea | 6.0 | 3.0% |
| Other Countries | 73.6 | 36.6% |
| Total | 201.1 | 100.0% |
source ; Argaam


